Case Studies
JFE Techno-Research Corporation: Ultim Extreme Detector – The Start of a New Era in SEM/EDS Analysis
Author: Kaoru Sato, Takaya Nakamura
Published: 01 Feb 2022 · Last updated: 27 Oct 2026
Tags: EDS Software
Scanning Electron Microscope (SEM)/Energy Dispersive X-ray Spectroscopy (EDS)
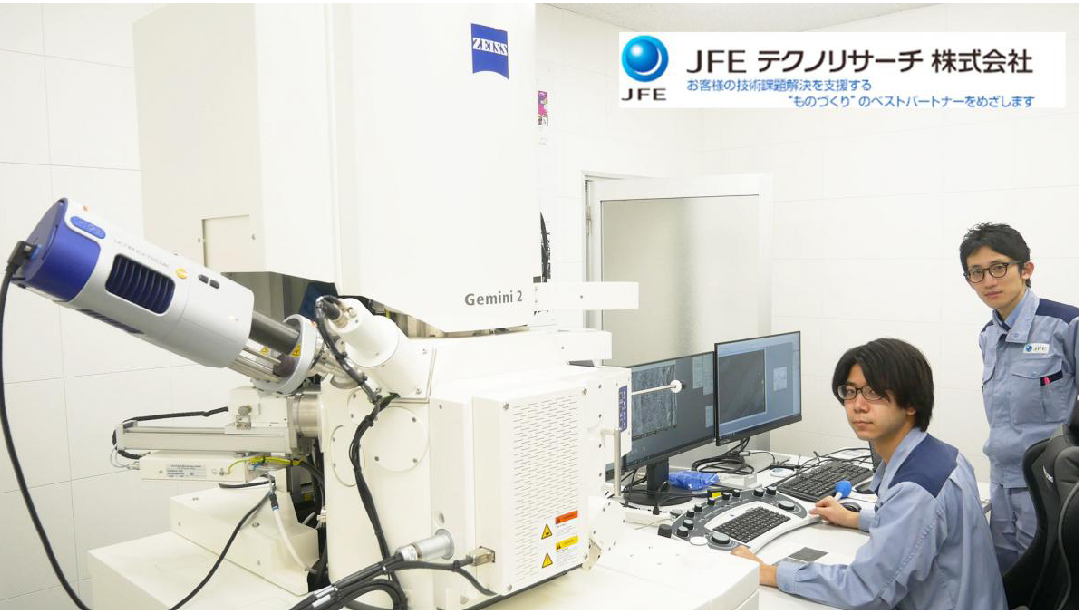
Utilising state-of-the-art analytical and testing equipment, JFE Techno-Research Corporation (JFE-TEC) provides highly reliable analysis and characterisation techniques with the aim of being the clients' best partner for target-driven problem-solving in monodzukuri (Japanese-style manufacturing). In August 2021, JFE-TEC introduced the Oxford Instruments windowless-type EDS detector, Ultim Extreme, which is attached to ultra-low-voltage scanning electron microscopes (ULV-SEM) manufactured by Carl Zeiss. In this Special Case Study, Dr. Kaoru Sato, JFE-TEC Fellow and specialist in microbeam analysis, and Mr. Takaya Nakamura of the company's Material Analysis Dept. explain why the Ultim Extreme was introduced and how this advanced detector is being used.
About JFE Techno-Research Corporation
JFE Techno-Research Corporation (abbreviated JFE-TEC) is a company in the JFE Steel Group which specialises in commissioned analysis, characterisation and investigation work.
The Challenge
In scanning electron microscopy, the specimen surface can be clearly visible at low accelerating voltages, but there was no EDS available that was capable of analysing specimens under the observation conditions for obtaining the optimum image (= 'Sweet spot of imaging').
The Benefit
Detectability of light elements was drastically improved, and low energy X-rays could be measured with high sensitivity, enabling analysis at the 'imaging sweet spot.' Although use of the M line and N line had been difficult with the conventional technology, this also becomes possible thanks to the introduction of the Ultim Extreme detector.
Q: Why did JFE-TEC introduce the Ultim Extreme windowless-type EDS detector?
#Copyright © 2022 JFE Techno-Research Corporation
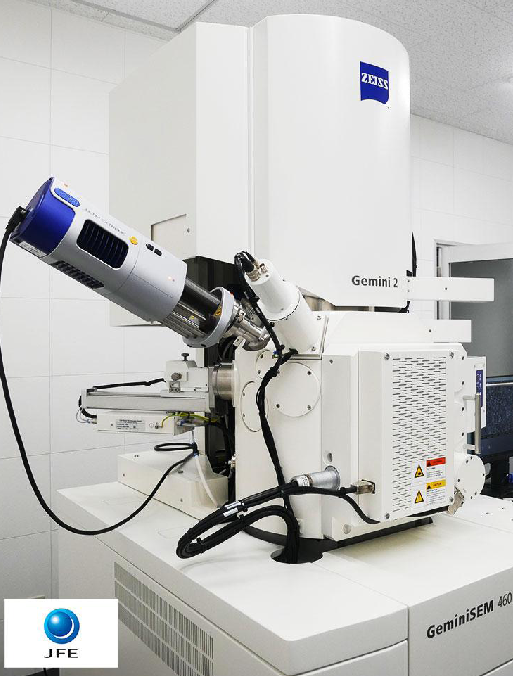
Carl Zeiss ULV-SEM (GeminiSEM 460) and the Oxford Instruments windowless-type EDS detector (Ultim Extreme) at JFE-TEC's Chita Solution Division
Dr. Sato begins, "We have been using Carl Zeiss ultra-low-voltage SEMs for more than 20 years. Because these instruments enable extremely good image observation at low accelerating voltages and also are equipped with multiple imaging detectors, we can capture surface information that could not be observed before. On the other hand, when evaluating materials, simple observation is not sufficient. Information on the elements present in the observed image is also necessary. Although EDS has been used widely for some time, with the conventional technology, there were many cases where the observation conditions and the analysis conditions did not match, and this resulted in various restrictions, for example, it was necessary to increase the accelerating voltage, and/or to lower the specimen height.
"We felt very frustrated with this," continues Dr Sato, "and at that time, we purchased a new product called Ultim Extreme from Oxford Instruments. Using this product drastically improved the detectability of characteristic X-rays, including those from light elements. It was also a great advance that both observation and analysis could be performed without changing the observation conditions used to obtain the optimum image – what we call the 'sweet spot of imaging.'
"Until then, observation and analysis were not very well linked, but thanks to the appearance of the new Oxford Instruments detector, it has succeeded in satisfying our needs of both observation and analysis. The key point here is the fact that both observation and analysis under the 'sweet spot condition' could now be realised simultaneously.
"Specifically, this means that we can proceed directly from imaging to analysis," elaborates Dr Sato further, "that is, characterisation of the specimen, without changing the accelerating voltage and working distance used in image observation. Our methodology is to capture images that contain a wealth of surface information by using low accelerating voltage SEM, and then proceed to the analysis using the same conditions. We are applying this methodology to a diverse range of materials."
Q: What are the good points of Oxford Instruments EDS?
"I feel that the most important advantage is that analysis can be conducted without changing the sweet spot of the SEM image," explains Mr. Nakamura, "in particular, while keeping the same low accelerating voltage and short working distance. Another attractive feature is the high sensitivity, that is, detectability for low energy X-rays, which was accomplished by the windowless design and optimised geometry of the detector. For example, this detector is extremely effective in analysis of functional materials and thin films composed of light elements."
Q: Could you give us some specific examples of analysis using the Oxford EDS?
1) Analysis of graphene oxide thin film
#Copyright © 2022 JFE Techno-Research Corporation
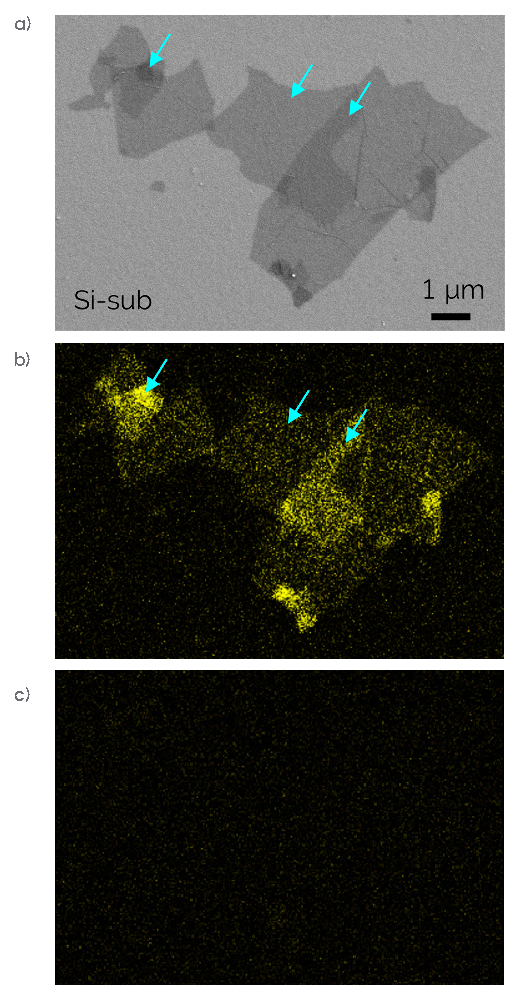
Fig. 1 — a) ET-SE image (low accelerating voltage condition: 1 kV); b&c) EDS C-K elemental mapping images (acquired at low accelerating voltage: 1 kV). b) Acquired with Oxford Instruments Ultim Extreme; c) Acquired with conventional thin-window type EDS detector.
"In this example," Mr. Nakamura continues, "we analysed a graphene oxide thin film dispersed on a silicon (Si) wafer. Because graphene oxide has a number of excellent properties, including a high aspect ratio, a large surface area and good dispersibility, it has attracted attention as a candidate next-generation fuel cell material, antibacterial and antiviral material, catalyst and so on. The image on the left (Figure 1a.) is a secondary electron (SE) image of graphene oxide acquired at a low accelerating voltage of 1 kV. Here, the distribution of the thin graphene oxide, which has a sheet thickness of about 1 nm, has been clearly visualised.
"The image in the centre (Figure 1b.) is the result of the acquired C-K elemental mapping with Ultim Extreme with the same surface-sensitive accelerating voltage condition of 1 kV. As shown by the blue arrows in this image, we succeeded in capturing details including even the changes in the intensity of C, which reflect differences in the thickness of the graphene oxide. When we measured the sample with the conventional thin-window type detector at the same accelerating voltage condition, we couldn't detect the carbon in the graphene, as you can see in Figure 1c. However, we could capture these data by using the windowless-type Extreme detector because of a large detection solid-angle.
"In spite of the extremely large needs for analysis under this kind of low accelerating voltage condition, if only a low accelerating voltage analysis is conducted, we found that the signals couldn't be captured with the conventional thin-window type due to its insufficient count and sensitivity," Mr. Nakamura states. "However, when we performed the analysis with Ultim Extreme using the same condition as in image observation, we could capture the graphene distribution corresponding to the image, as shown in Figure 1b. As another surprising discovery, we also found that the carbon intensity increased in areas where the film was thicker. In other words, in this example, the Ultim Extreme detector enabled us to visualise even the variations in the thickness of a nm order film. This example gave us a real sense of the extraordinary sensitivity of the Ultim Extreme detector."
"There are two points here," Dr Sato comes back in, "and this example shows the 2nd point particularly well. The first point is the method of using the microscope, that is, the surface can be observed in great detail by lowering the accelerating voltage. The second is that the Oxford Instruments detector has made it possible to measure and clearly visualise features that were invisible before. I think this is a good example where the design and geometry of the detector worked effectively."
2) Analysis of particle surface of lithium ion battery cathode active material
#Copyright © 2022 JFE Techno-Research Corporation
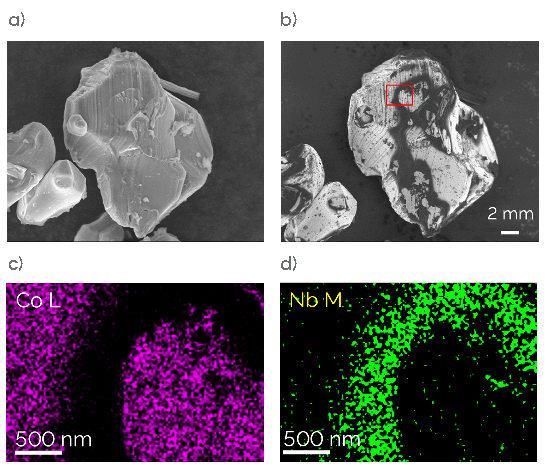
Fig. 2 — a) In-lens SE image (conventional condition: 10 kV); b) In-lens SE image (low accelerating voltage condition: 0.5 kV); c&d) EDS elemental mapping images (low accelerating voltage condition: 1.5 kV).
"Next, this is an example of an analysis of a specimen in which Nb compound coating was applied on the surface of LiCoO₂ particles, which are used in the lithium-ion battery cathode active material." Mr. Nakamura explains. "Although an accelerating voltage of 10 kV is frequently used, no information about the coating was obtained at this accelerating voltage. This is clear from Figure 2a. However, under the low accelerating voltage condition of 0.5 kV in Figure 2b., the coating layer on the surface can be visualised as dark contrast. The Ultim Extreme detector enabled us to visualise the presence and distribution of Nb by an EDS analysis at the same surface-sensitive low accelerating voltage. This is shown in Figures 2c. and 2d. In particular, visualisation using the Nb-M line was accomplished because we used Ultim Extreme detector which has high detectability for low energy. As a result, we succeeded in the EDS analysis at the 'sweet spot of imaging.'"
"Although no contrast on the coating is visible at 10 kV, by using our SEM observation techniques," Dr Sato comes in, "we can visualise the particles adhering to the surface extending even to their inhomogeneous distribution. Before Ultim Extreme, our general method when conducting an analysis was to increase the accelerating voltage, for example, to 10 kV, even if the surface was visible in observation at a low accelerating voltage. However, this meant that we were attempting to carry out the analysis without being able to see the target structure. In our experiments, not only speed, but also good quality is critical. You often lose the image contrast of interest when accelerating voltage is changed to a higher level. For instance, in this example, you can't determine which area should be analysed from the image in Figure 2a., but the points of interest can be seen in image in Figure 2b. I'd like to analyse the image exactly as I see it here. Being able to move on to the analysis immediately at the position of interest, not only contributes to speed, but also improves the quality of experiments."
Mr. Nakamura continues, "Just to add one more comment, the information depth is considerably different at 0.5 kV and 10 kV. If the SEM observation is conducted under a low accelerating voltage condition, but the EDS analysis is performed at a high accelerating voltage, the divergence between the information depths between the two will be quite large. Being able to carry out the analysis at the same accelerating voltage as the SEM observation is also an advantage from the viewpoint of reducing that divergence.
"Figures 2c. and 2d. are the results of an analysis of the area in the square in Figure 2b. at 1.5 kV. Conventional EDS detectors did not allow us to detect the Nb-M line, which is a low energy line with an energy of less than 200 eV. In contrast, owing to the extremely good low energy detectability of the Ultim Extreme detector, we can lower the accelerating voltage and carry out measurements using the Nb-M line, and as a result, the distribution of the coating on the surface can be captured, as demonstrated in this example. Here, the elemental mapping clearly shows that the intensity of the Co component decreases as the intensity of Nb increases in the area of dark contrast in Figure 2b.
"The topographic SE image reveals that a somewhat crater-shaped morphology is present along the thicker portion of the coating, and the condition during coating can be inferred from this feature. Visualisation of this kind of inhomogeneity of the coating will contribute to material and process design for achieving the ideal uniform, thin coating."
3) Analysis of fine precipitates in 2.25Cr-1Mo steel
#Copyright © 2022 JFE Techno-Research Corporation
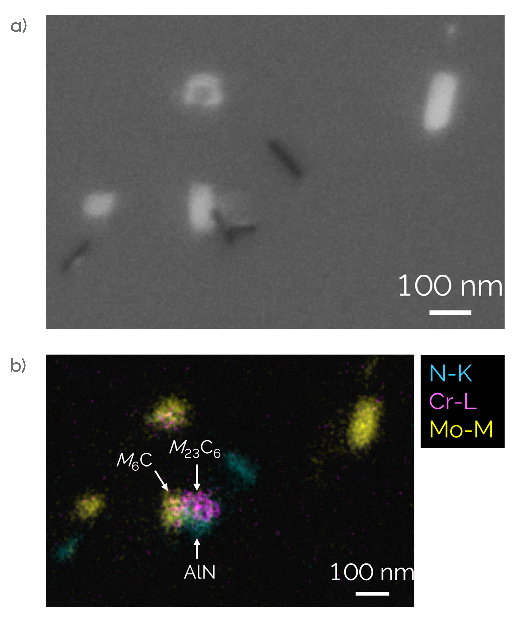
Fig. 3 — a) In-lens BSE image (low accelerating voltage condition: 1.5 kV); b) EDS elemental mapping image (low accelerating voltage condition: 1.5 kV).
Mr. Nakamura continues, "The third example is an analysis of fine precipitates in 2.25Cr-1Mo steel, which is used under high temperature environments, for example, in thermal power plants. Many types of carbides are present in this steel, and analysis of those carbides is important for material design and life prediction. In this example, the SEM observation and EDS analysis were both performed at 1.5 kV. Using EDS mapping of the constituent elements of the precipitates, that is, N, Cr, Fe and Mo, without changing the conditions under which the various precipitates were recognised in the backscatter electron image in Figure 3a., we succeeded in identifying M₆C, M₃₃C₆ and AlN, where M represents Cr, Fe and Mo. Because the penetration depth of the incident electrons can be reduced by using a low accelerating voltage, high resolution elemental mapping of fine precipitates with sizes to about 20 nm became possible."
Dr. Sato adds, "This data also drew a strong response from many Webinar participants, who said, 'Until now, I never knew that EDS can be applied at an accelerating voltage of 1.5 kV.'"
Q: How did you come to know about Oxford Instruments?
Dr. Sato explains, "In the 1980s, we began using analytical instruments made by a company called Link, which was a predecessor of Oxford Instruments. That was our first contact. From around that time, Link had a high reputation around the world for developing original hardware and software, and for high quantitative accuracy in analysis. We used the Link analysers for various electron microscopes, and Link later became a division of Oxford Instruments.
"I, myself, have a long interaction with the UK and have exchanged ideas on technology and future instrument development. In particular, because we started using low voltage scanning electron microscopes in earnest from around the year 2000, we had very high expectations for the new hardware embodied in this Ultim Extreme detector. Of course, we were not the only ones who realised the importance of this device; it was also recognised throughout the global scientific community. In an Oxford Instruments Webinar in 2020, I introduced this instrument to the world by saying 'The solution to these needs in SEM-EDS analysis is the Ultim Extreme detector – Oxford Instruments did the homework.' I might also mention that this product received a Queen Elizabeth Innovative Award in the UK. This is exactly the EDS detector we had been waiting for."
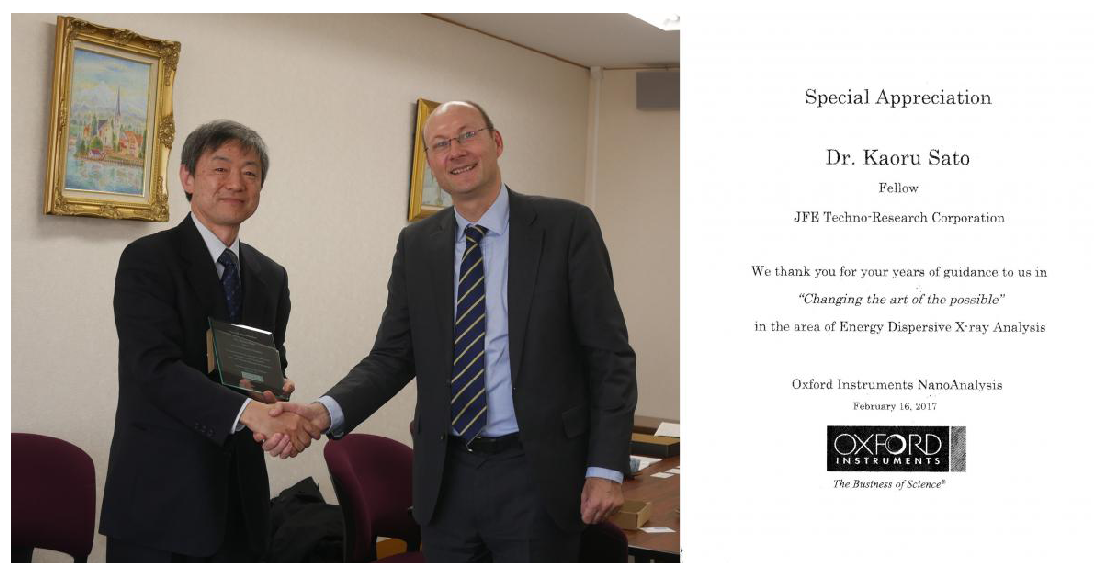
Dr. Kaoru Sato receiving a Letter of Appreciation from the CEO of Oxford Instruments, Dr. Ian Barkshire, for his contribution to the development of the Ultim Extreme detector.
Q: What kinds of development and progress do you hope to see in electron microscopes and EDS in the future?
Mr. Nakamura states, "I'm very surprised by what we have been able to see so far in the world of EDS by using the Oxford Instruments Ultim Extreme, but at the same time, new issues and challenges have also emerged. I feel that one important issue is improving accuracy in quantification at low accelerating voltages. A complete theoretical simulation of X-ray spectra is difficult in principle, but since the method for visualising distribution in qualitative terms is achieved, I think that taking a step forward from that and improving the accuracy of quantification as much as possible is one major issue that should be addressed in the future. Beyond that, although it's a bit greedy to say so, I'd like to see a further increase in the detection solid-angle. Also, it is still difficult to measure areas in the shadow of a sample. I hope you'll aim at a detector design and/or geometry that minimises the sample shadow effect."
"Until now," Dr Sato adds, "the general practice has been to adopt a general-purpose design for analytical instruments so they can be mounted on any electron microscope. However, I think it is necessary to go a step beyond that, to integration and optimisation of the microscope itself and the analytical instruments as a total system. In other words, the next generation instrument has to be a highly-integrated system for target-driven characterisation", concludes Dr Sato.