AFM Systems
AFM Accessories
Learning
Contact Us
 Part of the Oxford Instruments Group

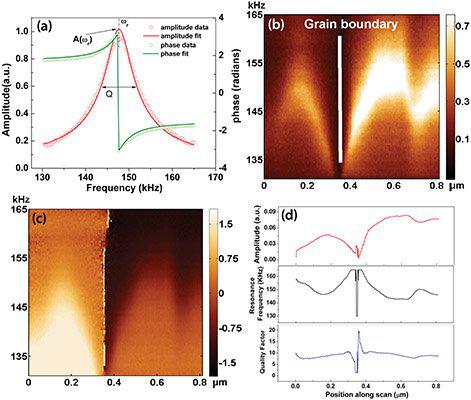
Grain boundary in a polycrystalline ferroelectric ceramic. (a) BE amplitude and phase response at a single spatial location, and a fit by the simple harmonic oscillator model. 2D BE (b) amplitude and (c) phase vs. frequency and location profiles, analogous to line profiles in single-frequency SPM. In contrast to a line profile, the amplitude and phase as a function of frequency (vertical axis) are represented by a color scale. (d) Amplitude, resonant frequency, and phase across the interface extracted from data in (b) and (c), 800 nm scan size.
Date: 16th November 17
Last Updated: July 12, 2018, 11:13 am
Author: Asylum Research
Category: Asylum Gallery Image
