There are a variety of spectroscopic techniques that will give information about the structure of a molecule. Nuclear
Magnetic Resonance (NMR) spectroscopy is a powerful technique for providing information about functional groups,
molecular backbone and the chemical environment of the nuclei in the molecule. While other techniques such as
infra-red and Raman spectroscopy can give information about the functional groups and molecular backbone respectively;
they cannot give all of the information about the molecule and the environment of the nuclei.
The principle of NMR is that the resonance frequency of a nucleus is determined by its gyromagnetic ratio and the
strength of the static magnetic field. If this was the only factor determining resonance then nuclei of the same type
would have identical frequencies. However, the resonance frequency of a nucleus also depends subtly on its location
within a molecule. More precisely it depends on the electron distribution in a molecule and the shielding effect of
the surrounding electrons. The shielding is the result of the static magnetic field inducing electron orbital motion.
This motion generates a small magnetic field in the opposite direction to the main field. Thus each nucleus
experiences a slightly different magnetic field depending on their location in a molecule. This effect is referred to
as chemical shift and is the basis for the chemical specificity that is one of the great strengths of NMR
spectroscopy.
Chemical shift is not the only information contained in a NMR spectrum. The magnetic interaction between neighbouring
nuclei mediated through the bonding network is referred to as J-coupling or scalar coupling. This coupling between
nuclei results in multiplets in the NMR spectrum. The number of spectral lines and spacing between them in a multiplet
provides additional information about the structure of a molecule.
In addition, NMR has the advantage that the amplitude of the NMR signal is directly proportional to the
concentrations of the contributing nuclei. Therefore, the ratio of the area under the different peaks corresponds to
the number of nuclei per molecule contributing to a resonance. The spectral peak integrals are useful additional
information that helps confirm spectral assignments.
Analysis
To demonstrate the quality of spectra that can be obtained at 1.4 T, corresponding to a 1H resonance
frequency of 60 MHz, the 1H spectrum from 5 small molecules are shown in figure 1. The molecules are
isomers, all having the same chemical formula C6H10O2; and contain a double bond
{−C=C−} and a carboxyl group {−C(=O)O−} in the form of an ester {R'−C(=O)O−R''} or a carboxylic acid
{R−C(=O)OH}.
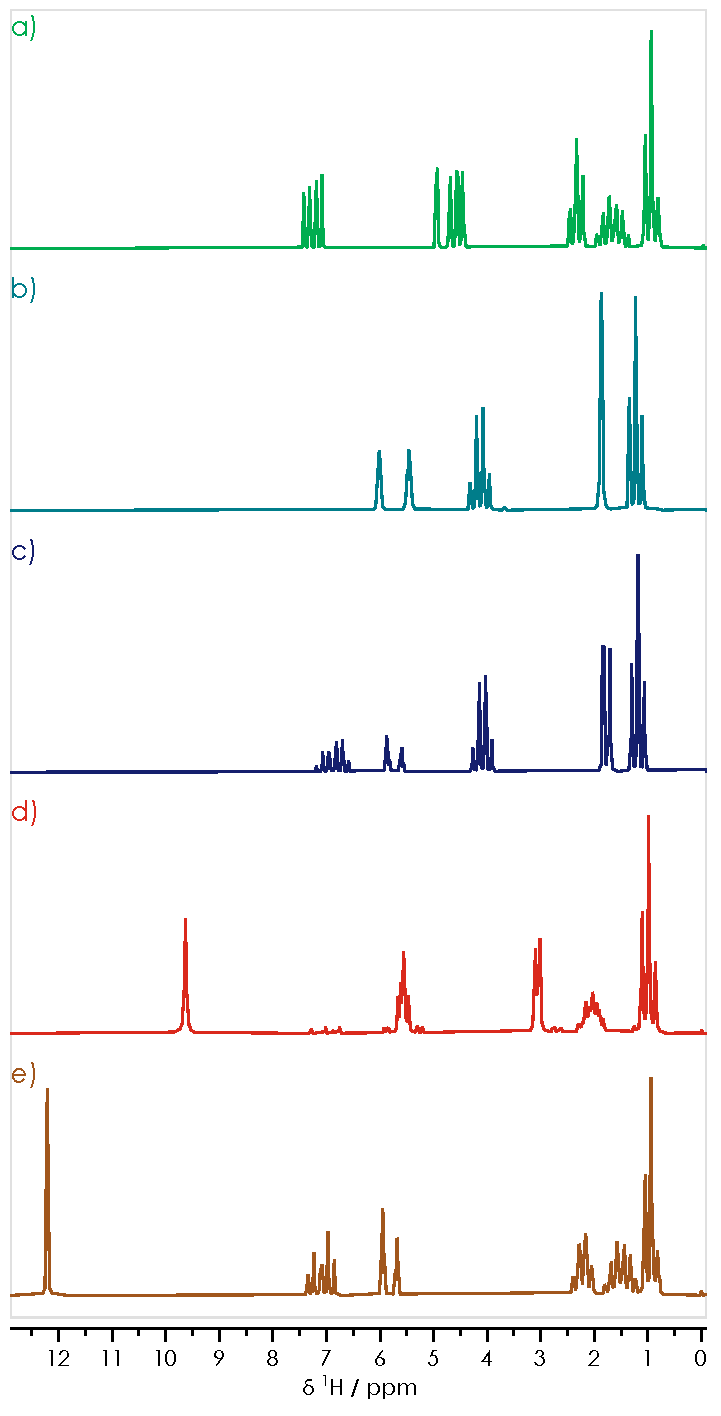
Fig. 1 — Spectra of 5 small molecules with the chemical formula C
6
H
10
O
2
: (a) vinyl butyrate, (b) ethyl methacrylate, (c) ethyl crotonate, (d) trans-3-hexenoic acid, (e)
trans-2-hexenoic acid.
Detailed Interpretation of the Ethyl Crotonate Spectrum
The 1H spectrum of ethyl crotonate (figure 2) acquired at 60 MHz is shown in figure 3. There are five
resonances, labelled 1 to 5, with a range of coupling patterns which can be used for
spectral assignment. Resonance 1 centred at 1.18 ppm is a triplet with a splitting of 7.1 Hz.
Resonance 2 centred on 1.78 ppm is a doublet of doublets with splittings 6.8 and 1.6 Hz. Resonance
3 centred at 4.09 ppm is a quartet with splitting 7.1 Hz. Resonance 4 centred 5.73
ppm is a doublet of quartets splitting 15.5 Hz and 1.6 Hz. Resonance 5 is a doublet of quartets
centred at 6.89 ppm with splittings 15.5 Hz and 6.8 Hz. The spectral information is summarised in table 1.
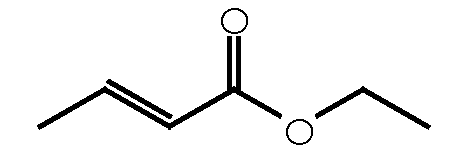
Fig. 2 — Chemical structure of ethyl crotonate.
Considering the chemical shifts only and comparing them to typical values for 1H nuclei, resonances
1 and 2 are likely to originate from the two methyl groups (−CH3), with
resonance 3 originating from the methylene group (−CH2−) and the source of resonances
4 and 5 are the two alkene 1H nuclei. The splitting pattern of resonances
1 and 2 can be used to assign the appropriate methyl groups. The triplet pattern of
resonance 1 and the single splitting imply that the nuclei assigned to resonance 1
should have two identical neighbouring 1H nuclei, while the doublet of doublets structure in resonance
2 implies two non-identical neighbouring 1H nuclei with two different splittings. It is
now possible to assign resonance 1 to the methyl 1H nuclei of the ethyl group
(CH3−CH2−). Further evidence for this assignment is resonance 3 which has been
assigned to the methylene hydrogens of the ethyl group. The quartet structure implies three identical neighbouring
1H nuclei with the same splitting as resonance 1. In fact the triplet-quartet pair of
resonances with an approximately 7 Hz coupling, is typical of an ethyl group. Resonance 2 can be
assigned to the second methyl group that is adjacent to the double bond, where the two alkene 1H nuclei are
the source of the two different splittings.
Splittings across a double bond are typically larger than those across a single bond and the mutual coupling between
the two alkene 1H nuclei accounts for the 15.5 Hz splitting. The coupling between two 1H nuclei
becomes weaker the greater the number of bonds between them. Resonance 5 can be assigned to the
alkene 1H nuclei closest to the methyl group, accounting for the three-bond 6.8 Hz splitting. Resonance
4, therefore, can be assigned to the alkene hydrogen nuclei closest to the carboxyl group with the
weaker four-bond coupling to the methyl group.
Further evidence for the assignments can be obtained by integrating the area under each of the resonances.
Normalising the sum of all five integrals to a value of 10, it can be shown that each resonance corresponds to the
correct number of nuclei.
It is notable in figure 3 that the multiplet patterns of the resonances are not symmetrical and in the case of the
ethyl groups (−CH2−CH3) do not conform to the binomial pattern, 1:3:3:1 and 1:2:1, of peak
amplitudes. The asymmetry is particularly obvious in resonances 4 and 5, although it
is still noticeable in the other resonances. The source of the asymmetry is strong coupling; at 60 MHz the differences
in chemical shift between two neighbouring nuclei is not necessarily much larger than the scalar coupling between
them. Under these conditions the weak coupling assumption is no longer valid and coupling patterns associated with
weak coupling should not be expected.
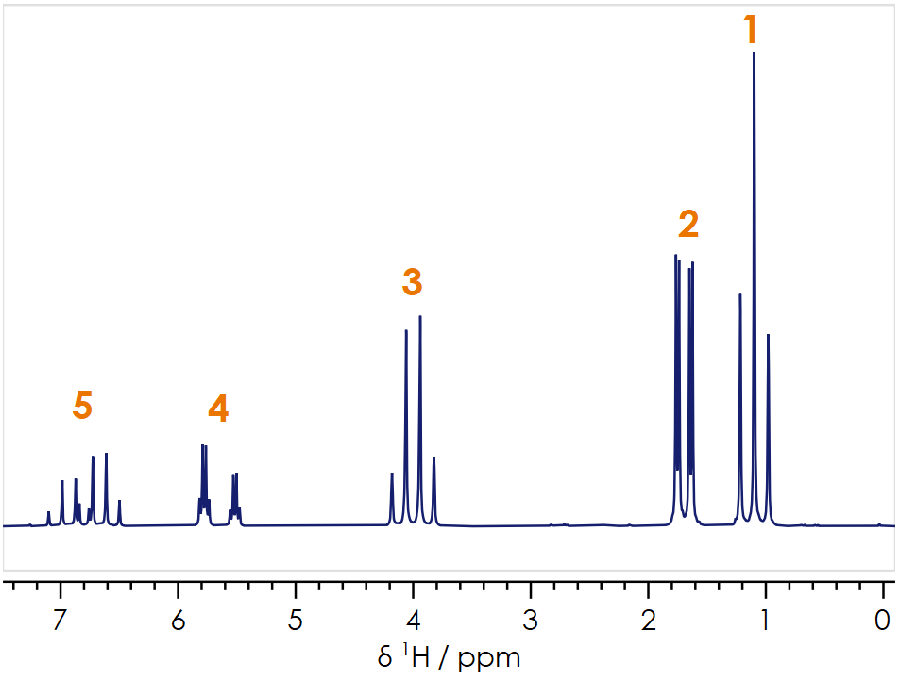
Fig. 3 —
1
H spectrum of ethyl crotonate in CDCl
3
acquired at 60 MHz.
|
δH / ppm |
Multiplicity |
JHH / Hz |
Integral |
Assignment |
| 1 |
1.18 |
triplet |
7.1 |
3.04 (3) |
ethyl, −CH3 |
| 2 |
1.78 |
doublet of doublets |
6.8, 1.6 |
2.99 (3) |
crotonyl, −CH3 |
| 3 |
4.09 |
quartet |
7.1 |
2.00 (2) |
ethyl, −CH2− |
| 4 |
5.73 |
doublet of quartets |
15.5, 1.6 |
0.99 (1) |
crotonyl, =CH−C(=O)− |
| 5 |
6.89 |
doublet of quartets |
15.5, 6.8 |
0.98 (1) |
crotonyl, −CH= |
Table 1: Summary of the spectral information and peak assignments for ethyl crotonate.
Comparison of trans
-2-hexenoic and trans
-3-hexenoic Acid Spectra
The 1H spectra of trans
-2-hexenoic acid (figure 4, left) and trans
-3-hexenoic acid (figure 4, right) acquired at 60 MHz are shown in figure 5, with the spectral information summarised
in table 2. As with ethyl crotonate, by considering the chemical shift, splitting patterns due to scalar coupling and
peak integrals, the resonances seen in the spectrum of the two carboxylic acids can be assigned to the different
1H nuclei.
There are a number of notable features in the two spectra. Shifting the double bond by one carbon has quite a
dramatic effect on the 1H spectrum. The broad peak that is characteristic of a carboxylic acid group, shows
a shift of around 2.5 ppm when the carboxylic acid group is one carbon further away from the double bond
(10a & 10b). In addition the double bond in the trans
-3-hexenoic acid is flanked on either side by a methylene group, the result is that the two alkene hydrogens, −CH=
experience very similar chemical environments and as a consequence have very similar chemical shifts; in the spectrum
of trans
-3-hexenoic acid they are virtually superimposed (9a). In contrast the two alkene hydrogen nuclei in
trans
-2-hexenoic acid have markedly different chemical shifts and show very different splitting patterns due to their
different neighbouring groups (9b & 9c).

|
δH (ppm) trans |
-2- |
δH (ppm) trans |
-3-Assignments |
| 6a & 6b |
0.93 (3H) |
0.98 (3H) |
6-CH3 |
| 7a & 7b |
1.49 (2H) |
2.05 (2H) |
5-CH2 |
| 8a |
− |
3.06 (2H) |
2-CH2 |
| 8b |
2.17 (2H) |
− |
4-CH2 |
| 9a |
− |
5.57 (2H) |
4-CH & 3-CH |
| 9b |
5.82 (1H) |
− |
2-CH |
| 9c |
7.10 (1H) |
− |
3-CH |
| 10a & 10b |
12.21 (1H) |
9.63 (1H) |
1-COOH |
Table 2: Comparison of Chemical Shifts for trans-2- and trans-3-hexenoic acid.
Summary
NMR has been shown to be an extremely useful analytical technique for the characterisation of these small molecules.
It has been possible to assign the peaks to particular nuclei in the molecule and observe the effect that the
environment of the nuclei can have on the chemical shift of the peaks in the NMR spectrum. This is particularly useful
in this example where the molecules have the same molecular formula. The differences in the NMR spectra that would be
observed with totally different chemicals with different chain lengths, functional groups and chemical environments
would be even greater, although the same principles would apply:
- The chemical environment of the nucleus will influence the chemical shift of the peaks in the spectrum.
- The peak integrals from the spectrum will indicate the number of nuclei giving rise to that specific peak or peak
multiplet.

