AFM Systems
AFM Accessories
Learning
Contact Us
 Part of the Oxford Instruments Group
You probably know that batteries have electrical currents, internal ion flows, and chemical reactions. But have you ever wondered what structural changes happen inside the battery during charging or discharging? That’s a common question, but it’s surprisingly critical and difficult to answer. For most battery architectures, it is not possible to “look” inside during (dis)charge with an operando measurement: no light-based techniques can simultaneously penetrate the battery and image nanoscale features effectively. (Not to mention, taking the battery apart would make it stop working.)
For lithium (Li) battery technologies, we know from post-operation analysis that a chemistry-dependent solid-electrolyte interphase (SEI) generally forms and dissolves during discharge and charge cycles, respectively. In the schematic of a generalized Li battery in Figure 1, the interfaces of interest for SEI formation are highlighted. However, little is known about the structural evolution of this SEI as a function of time, charge state, and cycle number. Crucially, SEI structure influences current density, battery capacity, achievable output voltages, operational lifetime, and even safety (after all, we don’t want those hoverboards catching fire). So, understanding SEI evolution will help make better, longer-lasting, safer batteries.

Figure 1. Schematic depicting primary battery components, current, and ion motion during charge and discharge. The mysterious, uncharacterized interfaces of interest where the SEI forms are indicated by the yellow boxes.
Other issues make this research even more complex. Lithium metal is typically unstable towards high concentrations of oxygen, nitrogen, water, and other volatile and reactive molecules, so Li batteries usually must be assembled and tested in dry, argon-filled gloveboxes. Also, the proprietary solvents and electrolyte blends used in batteries (organic carbonates, ionic liquids, organic-soluble salts, etc.) can be toxic, flammable, still under development, or poorly characterized.
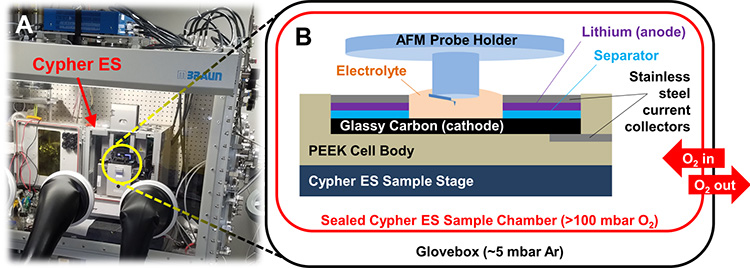
All this means we need an advanced instrument with a well-controlled environment to successfully image the dynamics of electrodes and charge-transfer interfaces in batteries in realistic operating conditions. Enter the Cypher ES Environmental AFM with its accompanying Electrochemical Cell (EC cell) from Oxford Instruments Asylum Research. As seen in Figure 2, the Cypher is straightforward to integrate with an argon glovebox, and its environmental chamber allows for further atmospheric control right at the sample. Meanwhile, the EC-specific probe holder lets the AFM probe dip down into an electrolyte bath, making it possible to image coin-cell-type battery geometries.
One of Asylum’s experienced users, Dr. Kumar Virwani at IBM Almaden Research Center, used exactly this instrumentation to obtain the electrochemical AFM (EC-AFM) data presented below. He took advantage of the intense reactivity of Li towards oxygen and water to investigate Li-O2 batteries modeled after those in a previous study [i].

Figure 2. Li-O2 battery testing with a Cypher ES in an argon glovebox. (A) Photograph of the Cypher ES integrated into an Ar-filled Mbraun glovebox. (B) Schematic of the battery cell and sealed sample chamber used in these experiments. Pure O2 flows into the AFM but does not escape into the glovebox atmosphere due to the hermetic seal of the sample chamber.
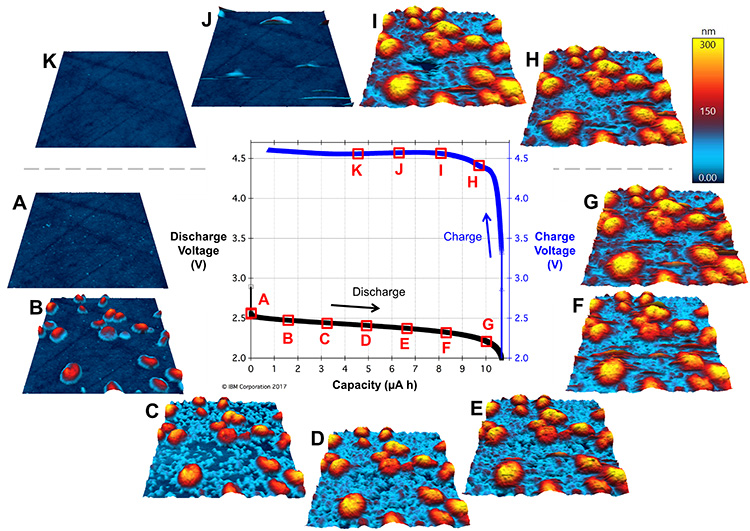
In Figure 2, some readers might immediately flinch at seeing oxygen apparently being pumped into the glovebox—usually a catastrophic no-no in glovebox research. However, the fully sealed Cypher ES sample chamber and tubing keep the in-flowing O2 separate from the glovebox atmosphere, even at positive O2 pressure. This meant Kumar could cycle Li-O2 batteries for up to a week (wow!) and monitor the operando evolution of the cathodic SEI as a function of time and charge state. Figure 3 shows EC-AFM images of the cathode surface of such a battery at various points in a single discharge/charge cycle of ~10 h. In these measurements, the probe is a non-perturbative observer of the topography; it remains electrically floating and uninvolved in the chemical reaction.

Figure 3. Li-O2 battery cycling and operando EC-AFM images. In the center is the discharge/charge voltage cycle plotted against the capacity, surrounded by tapping-mode images of the cathode SEI topography obtained at the timepoints A-K indicated in the cycle. The cathode was polished glassy carbon, the anode was Li metal, the solvent was tetraglyme, the electrolyte was 1 M LiNO3, and the discharge/charge rate was 5 μA, corresponding to a full cycle time of ~10 h. The scan size is 3 μm x 3 μm and the height scale is 300 nm for all images.
These data suggest that in the early stages of discharge the SEI, a mixed-valence LixOy material, first nucleates in solution as large spherical/toroidal structures (Figure 3B), followed by the nucleation of smaller nanostructures on the cathode surface (Figure 3C). The spherical/toroidal shape of the large deposits is consistent with previous scanning electron microscopy results [ii] and is in part mediated by H2O molecules in the solvent [iii]. Cathodic nanostructures continue to increase in size during discharge, completely filling the spaces between large deposits by the time discharging is complete (Figures 3D-G). Upon charging, the structures initially persist (Figure 3H), then begin to dissolve (Figure 3I), and finally disappear by the time 50% state of charge is reached (Figures 3J and K).
Kumar’s paper is hot off the press [iv] and discusses these conclusions in depth. It also shows (1) EC-AFM data acquired with varying [H2O], (2) compelling videos of the SEI evolution obtained through extended operando EC-AFM imaging, (3) impedance spectroscopy, and (4) SEI volumetric analysis.
Examples of similar operando battery imaging are rare, especially in experimental conditions that mimic real battery chemistry. (In a notable recent example, sodium oxide (NaO2) batteries were analyzed with EC-AFM on the Cypher ES. It was found that the stability of the NaO2 discharge products in the electrolyte could help explain the high cyclability of the battery [v]). These measurements were possible thanks to the exquisite control of Cypher ES with the EC cell accessory and suggest this technique could readily be extended to other sensitive electrochemical measurements requiring extraordinary environmental control.
What EC-AFM measurements can you think of?
References
[i] Wen, R. et al. In Situ AFM Imaging of Li−O2 Electrochemical Reaction on Highly Oriented Pyrolytic Graphite with Ether-Based Electrolyte. Journal of the American Chemical Society 2013, 135 (29), 10870-10876. https://doi.org/10.1021/ja405188g
[ii] Zheng, H. et al. New Insight in Understanding Oxygen Reduction and Evolution in Solid-State Lithium–Oxygen Batteries Using an in Situ Environmental Scanning Electron Microscope. Nano Letters 2014, 14 (8), 4245–4249. https://doi.org/10.1021/nl500862u
[iii] Aetukuri, N. B. et al. Solvating additives drive solution-mediated electrochemistry and enhance toroid growth in non-aqueous Li–O2 batteries. Nature Chemistry 2015, 7, 50–56. https://doi.org/10.1038/nchem.2132
[iv] Virwani, K. et al. In situ AFM visualization of Li–O2 battery discharge products during redox cycling in an atmospherically controlled sample cell. Beilstein Journal of Nanotechnology 2019, 10, 930-940. https://doi.org/10.3762/bjnano.10.94
[v] Ansari, Y. et al. A Highly Stable Sodium–Oxygen Battery Using a Mechanically Reinforced Membrane. Advanced Energy Materials 2018, 8, 1802603. https://doi.org/10.1002/aenm.201802603
Date: August 2, 2019
Author: Dr. Nate Kirchhofer, Asylum Research
Category: Application Note
