AFM Systems
AFM Accessories
Learning
Contact Us
 Part of the Oxford Instruments Group

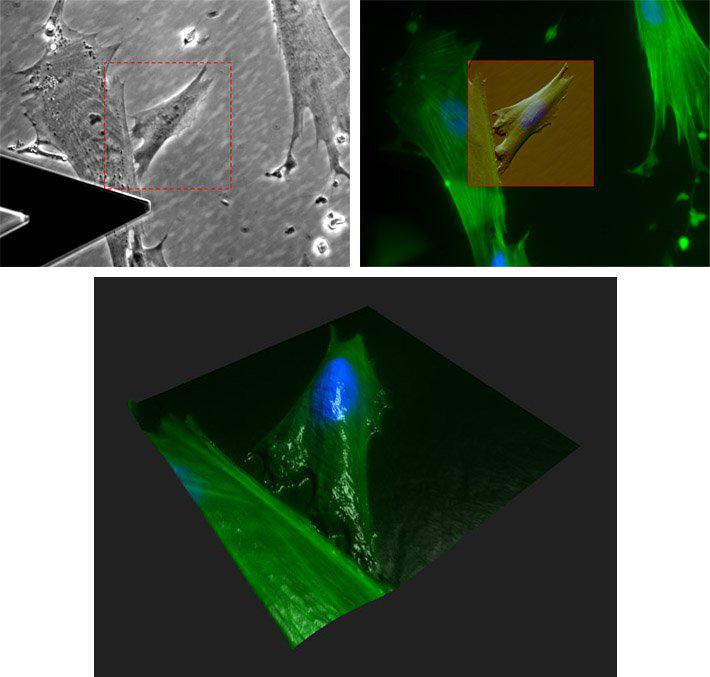
Cells are clearly visible in the optical phase contrast image (left). Desired region of interest (ROI) can be selected with the software ? a simple point and click defines the scan area (red box). AFM and optical images can be directly compared with the included video overlay software. The AFM image was overlaid onto the two-color merged fluorescence image and adjusted to 50% transparency in order to observe features in both channels (right). (bottom) A 3D rendering of the cells was created using the fluorescence channel to "paint" color onto AFM topography. Actin filaments (green) were stained with Alexa Fluor 488 phalloidin and DNA (blue) was stained with DAPI.
Date: 16th November 17
Last Updated: July 12, 2018, 11:13 am
Author: Asylum Research
Category: Asylum Gallery Image
