AFM Systems
AFM Accessories
Learning
Contact Us
 Part of the Oxford Instruments Group

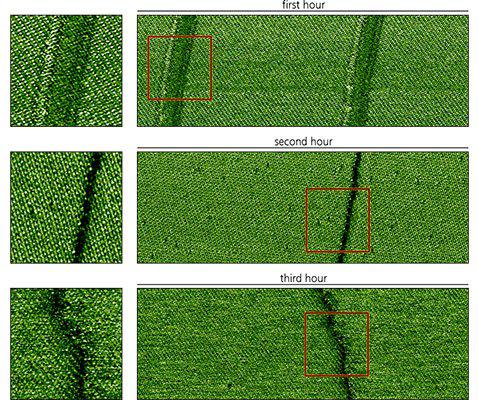
Calcite imaged in water over a period of more than three hours using blueDrive on a Cypher S AFM using a NanoWorld Arrow UHF-AuD cantilever. The width of each scan is 80 nm and the images were collected at 8 Hz line rate. You can see that over time the appearance of the calcite surface changes. Using conventional piezoacoustic excitation you would need to frequently adjust the amplitude setpoint to maintain stable imaging. It would be very difficult to interpret the changes in the images because the changes could be due to either varying imaging conditions (e.g. setpoint ratio) or changes in the shape of the tip. Using blueDrive, we know that the drive remains constant within 1%, so we can confidently attribute the changes in the images to slight rearrangements of the atoms at the tip. These images also provide a clear example of the difference between lattice resolution and true atomic resolution that resolves single point atomic defects. Note that in the first image the step edge appears quite wide compared to the lattice spacing and only the lattice, not point defects, are clearly resolved. In the third image, again the step edge is wide and it also appears uneven and again points defects are not clearly resolved. However, during the second hour of imaging the tip atoms were arranged more favorably and we see evidence of this in a very narrow transition at the step (similar to the lattice spacing) and very clearly resolved point defects that appear far from the step. In general, it is very difficult to interpret atomic scale images near step edges because multiple atoms at the tip are interacting with the surface. For a very sharp tip this transition region at the step becomes narrower, but still exists. Therefore it is only far from steps that one can confidently interpret defects as true single point defects in the crystal.
Date: 16th November 17
Last Updated: July 12, 2018, 11:13 am
Author: Asylum Research
Category: Asylum Gallery Image
