AFM Systems
AFM Accessories
Learning
Contact Us
 Part of the Oxford Instruments Group
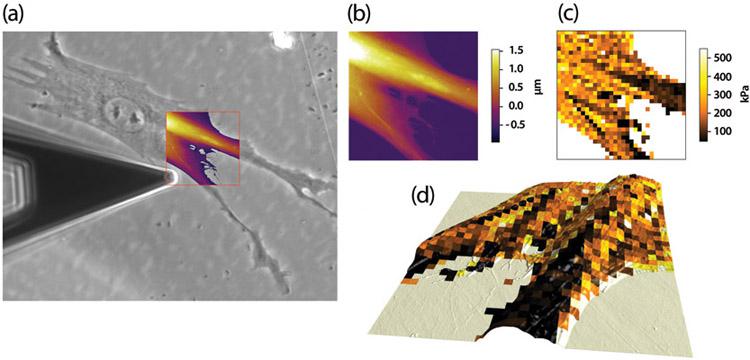
Force Mapping used for imaging and sample property measurements. The optical phase contrast image of a cell with the cantilever hovering over it, and with an optically defined region of interest (red box) for force mapping is shown in (a). After the AFM topographic scan (b), the elasticity force map was taken and analyzed using the Hertz model (see explanation below) and the modulus values were plotted and displayed as a 2D image (c). The modulus map was overlaid onto the AFM topography image and rendered in 3D using the Asylum ARgyle software in (d).

© Oxford Instruments 2026