AFM Systems
AFM Accessories
Learning
Contact Us
 Part of the Oxford Instruments Group
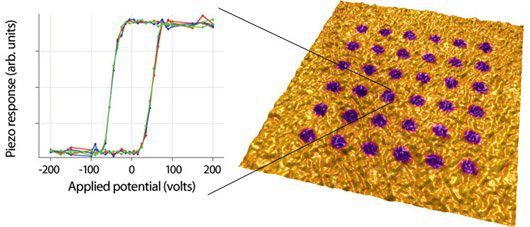
Rendered topography of a LiNbO3 sample with the PFM signal painted on top. Image was taken after Switching Spectroscopy Mapping. Graph shows the hysteresis loops measured at an individual point, 4 µm scan. Imaged with the MFP-3D AFM.

© Oxford Instruments 2026