AFM Systems
AFM Accessories
Learning
Contact Us
 Part of the Oxford Instruments Group

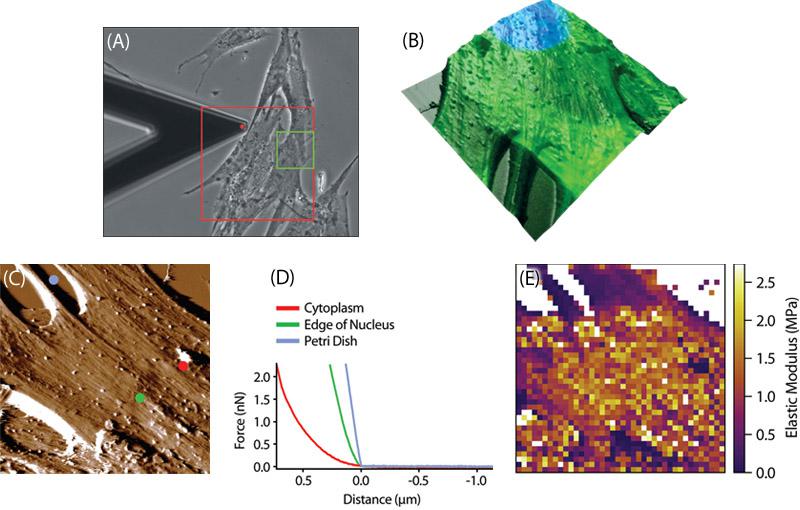
(A) Phase contrast identifying a region of interest. (B) Fluoresence (green: actin, blue: DNA) overlaid onto topography taken from the area indicated by the green box in (A). (C) AFM deflection image, 30 µm scan. (D) Force curve of selected areas of the AFM image. (E) Force Map displaying the measured modulus by color of each of the 1600 force curve points automatically taken on the cells and substrate. The lamellipodia at the top center of the force map appear much softer than expected due to the presence of a second cell underneath.
Date: 16th November 17
Last Updated: February 20, 2019, 5:23 pm
Author: Asylum Research
Category: Asylum Gallery Image
