AFM Systems
AFM Accessories
Learning
Contact Us
 Part of the Oxford Instruments Group
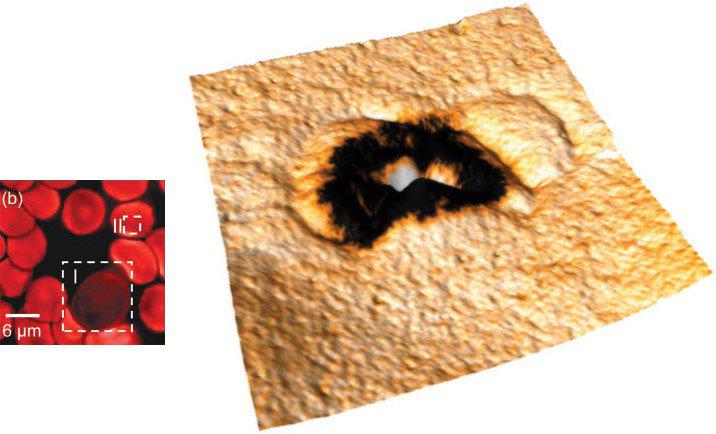
Left: Topographic image of red blood cells, 30 µm scan. Right: Close-up of individual cell outlined in larger scan (left) and labeled as II. The piezoresponse signal was painted on top of the topography, 2 µm scan. Imaged with the MFP-3D AFM. Image courtesy of B. Rodriguez and S. Kalinin, ORNL.

© Oxford Instruments 2026