AFM Systems
AFM Accessories
Learning
Contact Us
 Part of the Oxford Instruments Group
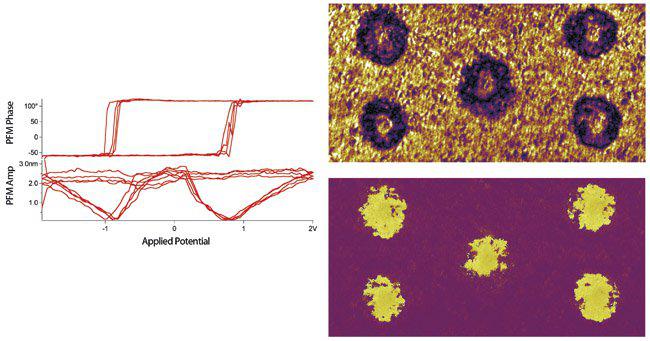
Sol-gel PZT sample where local hysteresis loops were measured and displayed (representative phase and amplitude loops shown at left). After the switching spectroscopy measurements, the area was imaged. The Dual AC Resonance Tracking (DART) amplitude (top) and phase (bottom) are shown, 3.5 µm scan. Imaged with the MFP-3D AFM.

© Oxford Instruments 2026