AFM Systems
AFM Accessories
Learning
Contact Us
 Part of the Oxford Instruments Group
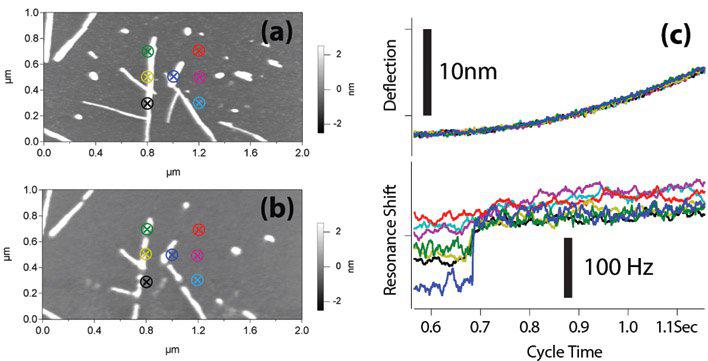
(a) shows a 1x2 µm AC (tapping) mode image of insulin fibers deposited on a mica surface. After imaging, a series of thermal-bending compensated, low-temperature thermal cycles were performed in a 12x6 array of points. A small selection of those locations are indicated by the colored markers in both (a) and (b). (b) shows an AC image of the same region after the thermal cycling was complete, showing numerous gaps in the fibers where thermomechanical decomposition has occurred. (c) shows the local thermal expansion (top deflection plots) and resonant frequency shifts (bottom plots) associated with the thermal cycles, color coded by location. Note the clear signal associated with thermal decomposition of the fibers visible in the resonant frequency shift curves. The deflection curves show no significant response at the same temperature. Note that some tip broadening has occurred during the thermal cycling that reduces the resolution between (a) and (b). Because the heating cycles were made at constant load, compensated for the thermally induced bending of the lever, the resonant shifts can be primarily attributed to thermal decomposition, rather than simple mechanical effects.

© Oxford Instruments 2026