AFM Systems
AFM Accessories
Learning
Contact Us
 Part of the Oxford Instruments Group
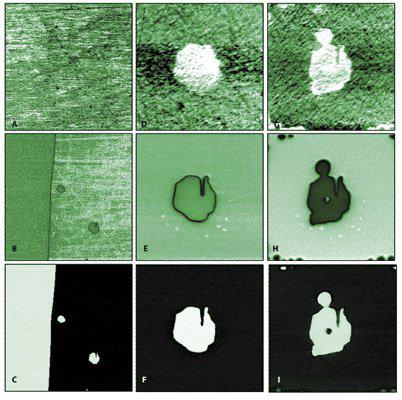
(A), (D), (G) resonance frequency, (B), (E), (H) piezoresponse amplitude and (C), (F), (I) piezoresponse phase images of antiparallel domains in lithium niobate. Shown are images of the (A)?(C) native domain structure, (D)?(F) an intrinsic domain and (G)?(I) domains switched by ±176 V (locations marked in (E)). The images are obtained at wf = 4kHz and Vac = 66V. The frequency images have been flattened to account for minute changes of contact radius from line to line. Imaged with the MFP-3D AFM. Reprinted with permission, Nanotechnology 18, 475504 (2007).

© Oxford Instruments 2026