AFM Systems
AFM Accessories
Learning
Contact Us
 Part of the Oxford Instruments Group

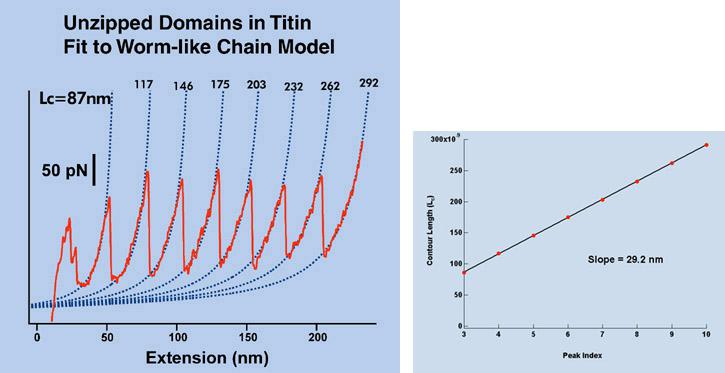
Left: Force curves taken with a protein molecule composed of repeating Titin domains tethered to the cantilever. The red curve shows the experimental data and the purple shows the fits to the worm-like chain (WLC) model. The contour lengths (Lc) increase as each domain is unfolded. Right: Contour lengths vs. peak index for unzipping curves. Data courtesy of J. Clarke, S. Fowler and A. Steward, Cambridge University, UK.
Date: 16th November 17
Last Updated: July 12, 2018, 11:13 am
Author: Asylum Research
Category: Asylum Gallery Image
