AFM Systems
AFM Accessories
Learning
Contact Us
 Part of the Oxford Instruments Group
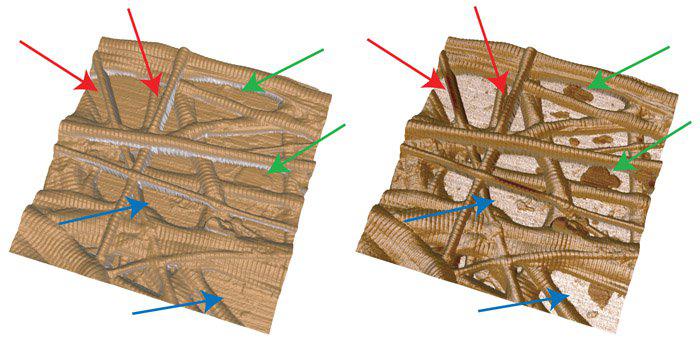
Side-by-side comparison of Type I collagen with the fundamental resonance phase data painted as an overlay on the AFM topography (left) and second mode phase data overlaid on the AFM topography (right). The red arrows indicate suspended fibers that absorb second resonance energy but show no fundamental resonance contrast. There are patches of contamination (green arrows) on the glass substrate (blue arrows). The second mode phase shows a distinct difference between the patches and the glass not visible in the first. 4 µm scan. Imaged with the MFP-3D AFM.

© Oxford Instruments 2026