AFM Systems
AFM Accessories
Learning
Contact Us
The AFM is uniquely capable of measuring the Young’s Modulus, sometimes called the Elastic Modulus, of materials with nanoscale lateral resolution. It can do this for a wide range of materials, from single molecules, through rubbers and polymers, to ceramics and metals.
Get Information from an AFM ExpertElastic Modulus is an umbrella term that refers to how much a sample is physically deformed (strained) when applying an external stress. In simple terms it is given by E = stress/strain. Young’s Modulus is the most commonly used type of Elastic Modulus and refers to the specific case of compressive or tensile elasticity – how something is made shorter or longer in the direction of the applied stress. Stiffer materials have large values of E, softer materials have lower values. The SI unit for modulus is called a “pascal”, denoted by Pa, where 1 Pa = 1 N/m2.
Young’s Modulus refers to the ratio of stress/strain in the linear part of the pictured curve. In this regime the strain is elastic, i.e., it is reversible if the stress is removed.
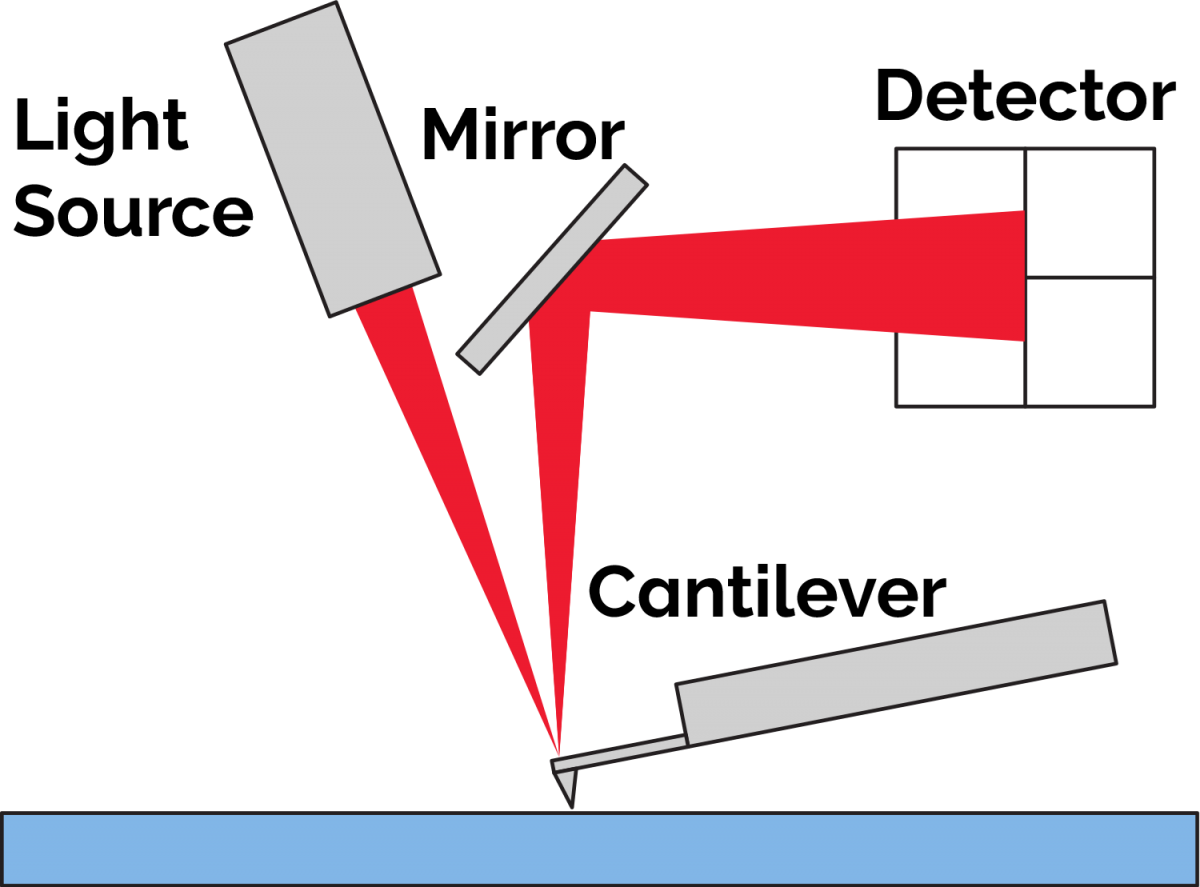
The atomic force microscope (AFM) is an instrument that “feels” the shape (topography) and various properties of surfaces by means of a microscopic physical probe. This probe consists of a mounting substrate with an extended cantilever and a sharp tip that points downward from the free end of the cantilever towards the sample. Physical and other force properties of the sample surface are determined by changing tip/sample distance, i.e., the z axis, and seeing how much this causes the cantilever to bend. The bending is measured by bouncing a laser beam off the top of the cantilever and onto a position sensing photodetector, which can be related to the force of the tip-sample interaction.
Changes in the force between the tip and sample cause bending of the cantilever. This bending is sensed with high sensitivity by laser beam deflection.

The AFM can be operated in over 30 different ways, called Modes, that measure different surface properties. Several of these modes can measure Young’s Modulus. The best choice depends on the stiffness of the sample as summarized in the table below. (There are also other modes that can be used to qualitatively map sample stiffness.)
|
Stiffness Range |
Typical Materials |
Applicable Modes |
Comments |
|
Pa-kPa |
Living cells & tissues |
|
Force Curves measure a force distance-curve, i.e., cantilever bending vs. the tip-sample (Z-axis) distance. Various indentation models can be used to calculate modulus from the data. Force curves can be measured at a single point or at an array of points across an area (called “force mapping” or “force volume mapping”). |
|
MPa |
Gels and Rubbers |
|
Force Curves in this range are measured in the same way as described above, but typically with a stiffer cantilever. The Fast Force Mapping (FFM) mode can produce some of the same information but is much faster. Amplitude Modulation-Frequency Modulation (AM-FM) is simple and can be done very rapidly. It can also provide measurements of the Loss Tangent (tan δ) which is related to viscous energy dissipation (damping). |
|
0.1 – 10 GPa |
Engineering Polymers |
|
Engineering polymers, often called thermoplastics, are rugged and durable materials that include polyesters and polyimides. Often the goal is to measure the nanoscale distribution of modulus across different components, so imaging or mapping techniques are usually preferred over single point force curves. For stiffer materials in this category, the Contact Resonance (CR-AFM) mode is a good option, although it is more commonly used for very stiff materials like ceramics and metals. |
|
>10 GPa |
Ceramics and Metals |
|
FFM and AM-FM can still be used with these materials up to ~100 GPa. But very high modulus materials like most metals and ceramics make Contact Resonance (CR-AFM) the best choice in most cases. CR-AFM works by rapidly exciting the cantilever at one of its vibrational resonance frequencies while the tip is in contact with the sample. Stiffer materials result in higher measured frequency, softer materials in lower values. This mode can also provide data on other physical properties, namely the Loss Modulus and Loss Tangent. |
All the modes described above can produce quantitative modulus data once properly calibrated. This calculation of Young’s Modulus from the raw AFM data is based on various contact mechanics models that describe the interaction between the indenter (AFM tip) and sample. The diversity of materials and possible experimental conditions means that no single model can correctly apply to all samples. For this reason, Oxford Instruments Asylum Research software provides a variety of analysis models that offers user-friendly flexibility and convenience.